
The 20% of Your Supply Chain Causing 80% of Your Emissions
Most manufacturers already know their Scope 3 emissions are large. What they don’t know is where, exactly, those emissions sit. A typical bill of materials for a mid-complexity product has hundreds of components. Most contribute almost nothing to the total carbon footprint. A handful drive nearly everything.
That handful is your hotspot list. Finding it is the difference between a decarbonization strategy that works and one that generates reports nobody acts on.
Try it yourself. Upload your BOM and see where your emissions are concentrated. No LCA expertise needed. Start free with CarbonMatch. → Click Here |
What is a carbon hotspot? A carbon hotspot is a specific component, supplier, or material that contributes a disproportionately large share of a product’s total greenhouse gas emissions. In most Scope 3 product carbon footprints, 20% of inputs account for 80% of total emissions. |
Why Most Companies Are Looking in the Wrong Places
The standard approach to Scope 3 measurement starts with spend. You take procurement data, multiply it by an economy-wide emission factor, and get a number. It’s fast. It’s also almost useless for finding hotspots.
Spend-based factors can’t tell you that a 12-euro connector has three times the carbon intensity of a 40-euro foam component. They treat all spend in a category as equivalent. What you get is a smooth, flat emissions map. No peaks. No hotspots. Nothing to act on.
The real problem shows up when OEM customers start requesting product-level PCF data. Suddenly you need numbers per SKU, per material, per supplier. Spend-based methods can’t give you that. And the manual alternative — working through each component in a spreadsheet — takes 8 to 16 weeks per product family. By then, the customer has moved on.
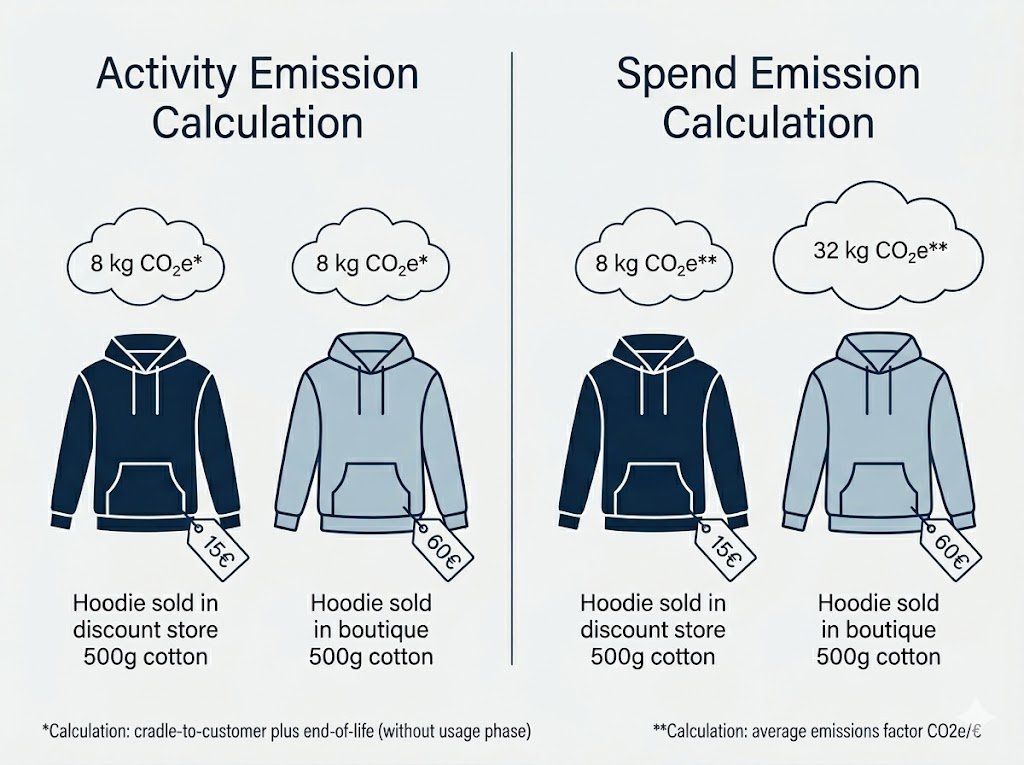
Comparison — Spend-based vs. Activity-based, supplier differentiation] |
Knowing Your Hotspots Is Only Half the Problem
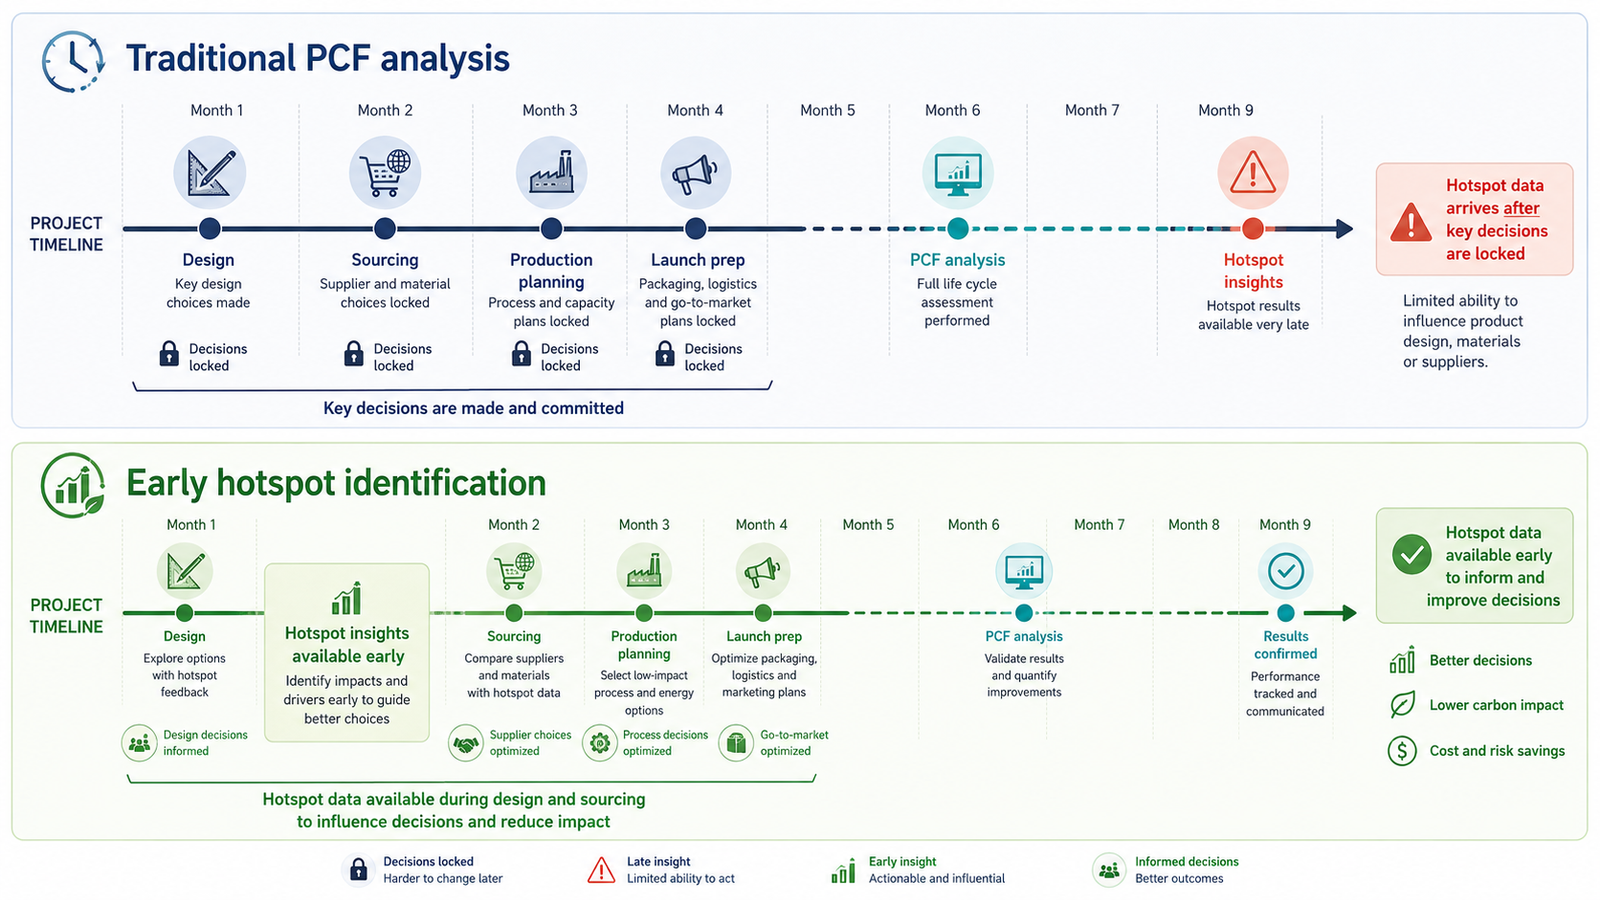
Here’s something that doesn’t get talked about enough. Many companies that do invest in proper PCF analysis — activity-based, BOM-level, the right way — still don’t move. The analysis gets done. The hotspot list lands in someone’s inbox. And then nothing happens for six months.
This isn’t laziness. It’s a structural problem. LCA consultants produce the data, but the people who can act on it sit in engineering or procurement. By the time the results are ready, the product design is frozen, the sourcing decisions have been made, or the team has moved on to the next project.
The companies that actually reduce emissions from their supply chains have one thing in common: they get to hotspot data early enough that it can still influence decisions. That means weeks, not months, into a project. It means product teams seeing emission data alongside cost data during design. Not after.
Traditional PCF analysis vs Early hotspot identification |
What Actually Gets You There Faster
The bottleneck in hotspot identification has always been emission factor matching. You have a BOM with component descriptions written by engineers. You have LCA databases with entries written by researchers. Connecting the two manually — finding the right Ecoinvent entry for ‘PBT connector housing GF30’ — requires LCA expertise most companies don’t have in-house, and takes time they don’t have to spare.
This is the specific problem CarbonMatch solves. It uses AI-powered semantic matching to connect your BOM descriptions to the right LCA database entries automatically. Every component gets an activity-based emission factor. Every match comes with a confidence score so your team knows where to focus review time. What took an external consultant four to six weeks takes a fraction of that.
The output isn’t a report. It’s a ranked view of your components by emissions contribution — your hotspot list, ready to take into an engineering or procurement conversation while it can still change something.
What is activity-based emission factor matching? Activity-based matching links each material or component in your BOM to a specific LCA dataset entry, rather than using a broad economic sector average. It produces component-level carbon footprints accurate enough for OEM reporting, supplier negotiations, and CSRD compliance. |
See it in action. Book a CarbonMatch demo and we’ll walk through your BOM live. → Click Here |
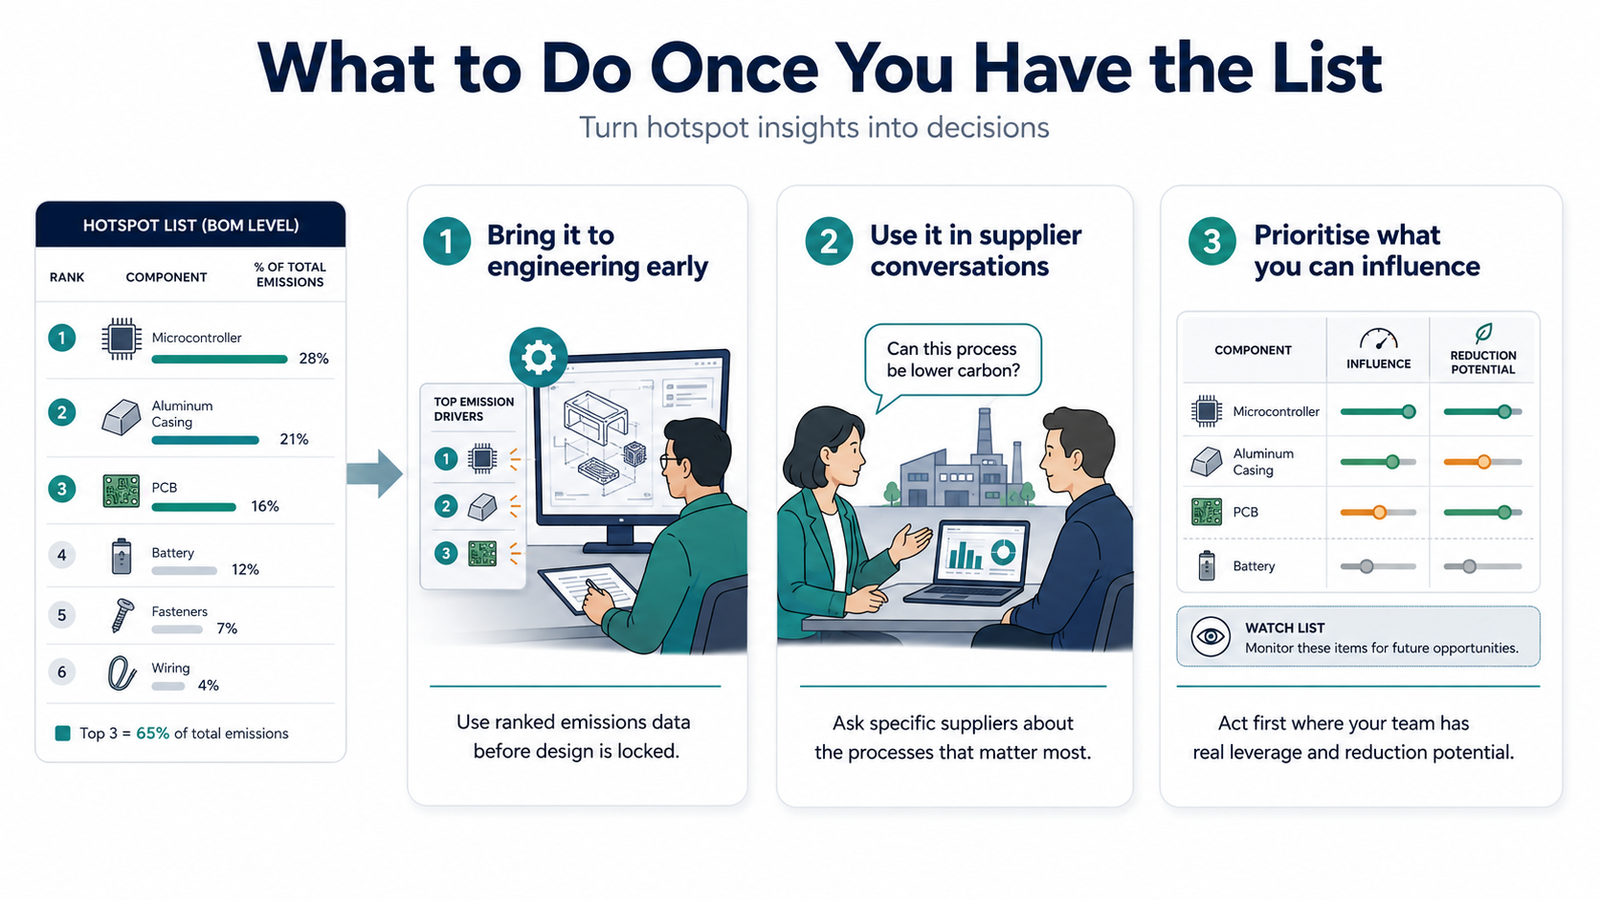
What to Do Once You Have the List
Getting your hotspot list is the start, not the finish. Here’s how to use it.
- Take it to engineering before design is locked
The most valuable moment to act on hotspot data is during product development, when material choices and component specifications are still open. A ranked emissions view at BOM level gives engineers a clear signal: these three components drive 60% of the product footprint. That conversation doesn’t happen if the data arrives after the design is finalised.
2. Use it in supplier conversations
Hotspot data at component level gives procurement a specific question to ask suppliers: what’s your emission factor for this process, and can you do better? Without it, the conversation stays generic. With it, you can target the suppliers where the reduction potential actually is.
3. Prioritise by what you can influence
Not every hotspot is equally actionable. Some sit in materials with no viable low-carbon alternative yet. Others involve suppliers where you have real purchasing leverage. Focus first on hotspots where your team can actually move the number. The rest goes on a watch list.
Simple ranked list graphic: 5 BOM components listed by CO2e contribution (highest to lowest). Top 2 highlighted with ‘Act now’ label, next 2 with ‘Monitor’, last with ‘Low priority’. Clean, minimal design.] |
Three Mistakes That Stall Hotspot Identification
- Starting with spend data. Spend-based factors flatten your emissions map. You won’t find hotspots with them. Start with a BOM and activity-based matching.
- Waiting for perfect data before acting. A matched BOM with 85% confidence on all factors is good enough to identify your top hotspots. Waiting for 100% means waiting forever.
- Treating hotspot analysis as a one-off exercise. Supply chains change. New components, new suppliers, new production sites. Run the analysis at the start of each new product development cycle, not once every two years.
Scope 3 reduction doesn’t happen in sustainability teams. It happens in design reviews, sourcing decisions, and supplier contracts. The role of hotspot analysis is to put the right data in front of the right people before those decisions are made.
Most companies get there too late, if they get there at all. The ones moving faster have stopped treating PCF analysis as a compliance exercise and started treating it as an input to product decisions.
If you want to see where your emissions are concentrated — across your products and components — try CarbonMatch. Upload your BOM and get your first hotspot view without an LCA consultant, without weeks of manual work, and without a sales call first.
Related reading: How AI is changing PCF calculation for manufacturers | Scope 3 emissions: what manufacturers need to know | PACIFIC: sharing PCF data across your supply chain


